Observing The Invisible
The Need For Visibility
When working with complex micro-services, that typically (by design) have no graphical user interface, just agreed API definitions and service levels, there is a need to provide visibility to understand exactly how they are performing and behaving, both from a business and operations viewpoint.
Capturing additional system metrics allows you to observe what might otherwise be invisible, enabling you to understand the detailed performance and behaviour of your systems such as peak usage patterns, data growth rates, average response times etc. as well as problematic scenarios and when systems are operating outside of normal tolerances.
Designing for visibility from the outset enables you to pro-actively manage and support systems and ensure that they continue to meet their agreed service levels and deliver business value.
Implementing Visibility

Like traceability, visibility doesn't happen by accident. You need a common strategy for how your different components and services will log, harvest and consolidate system metrics so that you can gain intimate knowledge of your systems.
It's important to determine exactly what metrics you need to know about your systems and so you will need to consult with various stakeholders to understand their needs.
Having a good handle on business and operational metrics will likely excite your customer and prompt further investment in your development team.
Business Metrics

Business metrics are often viewed in the form of reports and may be daily, weekly, monthly etc. Each report will focus on specific data with a specific viewpoint and so understanding exactly what your business stakeholders need to know will help you determine what to capture and how to stitch it all together.
Be sure to determine exactly what metrics your stakeholders actually "need" as this may be very different to what they initially said they "want" and significantly impact how much effort that would take to achieve.
Operational Metrics
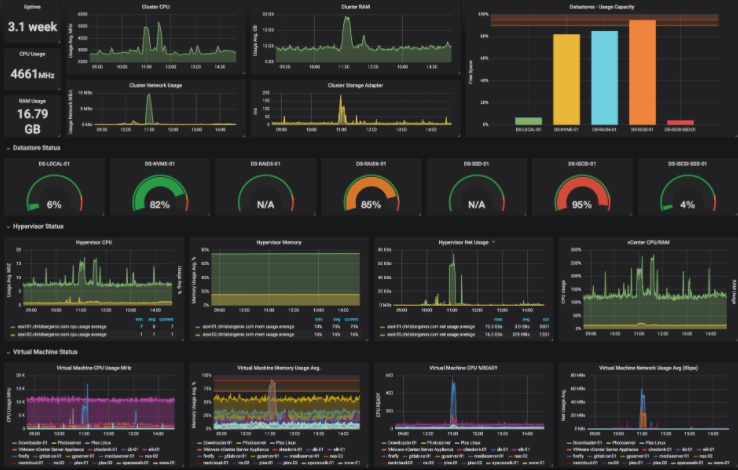
Operational metrics will relate not only to services and components but also to the platform technologies and servers hosting them. Such metrics may be captured and viewed in near real time on dashboards with the ability to go back in time and drill-down into specific services and components.
Platform technology metrics such as container orchestration tooling will likely be entirely separate from your services and components as will metrics from the servers or virtual machines hosting your components but you will need to be able to link these together to fully understand your system performance and behaviours. This may prove to be no small challenge!
Dashboard / Report Design
Dashboards and reports aren't there to look "pretty"; their purpose is to inform. Throwing a dashboard or report together without consulting stakeholders in advance will end up with the dashboard or report not being used or being re-designed to show meaningful content. The same is equally true with regard to your dashboard visual design or report layout so take the time to prototype and get feedback on different designs.
Screen sizes are limited so it's often necessary to design summary displays that users can navigate to drill down into more specific detail. Creative use of colour can be helpful although bear in mind some people are colour blind to certain colours.
It's often not enough to just quote numbers. You should expect to compare values and show differences and sometimes show trends and the direction and magnitude of change. Sometimes tabular data is required whilst some data is best shown as graphs or pie charts.
Keep Your Dependencies Close
Micro-services are often dependent on other systems which may not be under the control of your development team yet have a direct bearing on the outcome of your micro-services. For this reason, it's important to capture metrics for your dependencies such as response times, error rates, availability etc. and understand how these change over time.
Some dependencies may offer limited availability or bandwidth and may need to be throttled. Capturing system metrics will help you to understand such limits.
You may want to create a dependencies dashboard so that you can pro-actively monitor and react to issues that will impact your own services if not addressed.
Metrics Proving
Testing should be performed to prove that your metrics strategy is correctly in place for all system components. The metrics data itself also needs to be cross-validated and verified to prove that the figures you report and visualise on dashboards are correct.
Don't underestimate the importance of validating all of your reports and dashboards. It's not unusual to find bugs in them!
Dashboards and reports must be accurate and reliable. Prove that your calculations are correct by sampling the data. Ensure that the correct scales and units are always displayed (seconds, milliseconds etc.) on reports and dashboards.
Knowing What Normal Looks Like
What "normal" looks like for your systems can vary depending on the time of day, week or month etc. but a good reporting and visualisation strategy can help put things into context in a way that helps you understand whether what you are looking at is "normal" or not, or whether it is good or bad or out of tolerance with usual behaviour.
I can think of numerous occasions when I've been scrutinising systems and the support team have told me not to worry because that's normal behaviour for this time of day.
Acting On Metrics
Have detailed system metrics helps to predict future needs such as storage and compute capacity which can help you manage your costs more efficiently. They can also help you design your performance and volume tests more accurately.
I'm sure that you'll find that all of the effort you put into your system metrics strategy will prove increasingly worthwhile and allow you to gain valuable operational and business insights.
Tim Simpson
30th April, 2021
#LifeAtCapgemini